Adopt a City: Weather Activity
Task 1 – Finding your city
- Find your state and city using Google Maps (link).
- Make a dot to represent your city on your blank map
- Write the name of your city next to it.
- Using a yellow colored pencil, color in your state on the map.
- Glue the map into your notebook.
- What is your adopted city’s zip code? US Zip Codes (link)
- Add the zip code to your map.
- Using the zip code and weather website (link), find the current weather conditions
- Record the weather for today. (link)
- On the next page of your notebook, record the High (Maximum) and Low (Minimum) temperatures for the March 2018 in a table. If your table does not fit onto one page, you can continue on the next page in your notebook.
- Calculate the Mean, Median, Mode, and Range of the Maximum temperatures for the month of March.
- Calculate the Mean, Median, Mode, and Range of the Minimum temperatures for the month of March.
- What is the range of temperatures from the Highest temperature (Max.) to the Lowest temperature (Min.)?
- Turn your paper horizontally, with the holes at the top.
- Write the dates along the horizontal X-axis
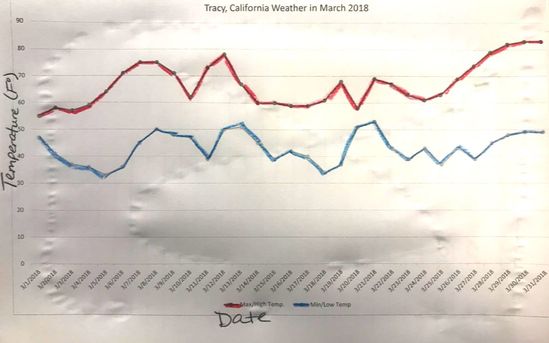
- Write the temperatures along the vertical Y-axis. You will need to decide what range of numbers to include on your graph, as well as how you are going to fit them. Notice on my graph below, I showed the temperatures from 0-90 degrees.
- Label your axis and give your graph a title
- Plot your data on your graph. Connect your Max/High temperature dots to make a line. Connect your Min/Low temperature dots to make a line. (see below for example)
- Color the Max/High temperature line red, and the Min/Low temperature line blue.